By the end of this topic
- Identify what to change, measure and keep the same.
- Write a clear, safe method with repeated measurements.
- Use results to answer the investigation question.
01Key terms & definitions
- Testable question
- A question that can be answered using observations or measurements.
- Hypothesis
- A possible explanation that can be tested using evidence.
- Independent variable
- The factor we deliberately change in an investigation.
- Dependent variable
- The factor we observe or measure.
- Control variables
- Factors we keep the same to make a test fair.
- Risk control
- An action that reduces the chance or seriousness of harm.
02Understand the idea
Start with a question
Science uses evidence to answer questions about the world.
- Evidence comes from observations and measurements.
- A testable question tells us what to compare and what to measure.
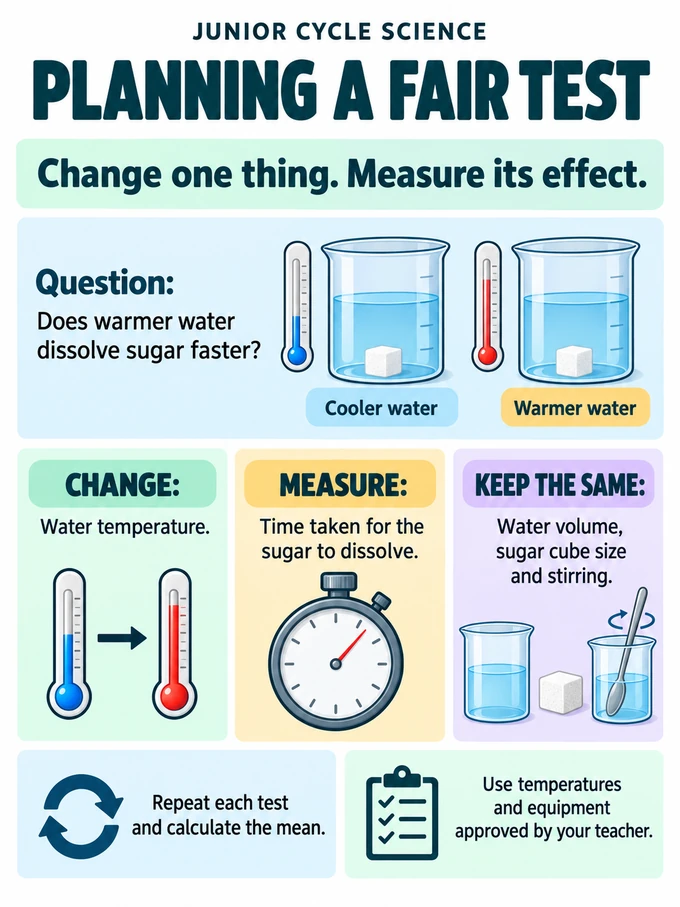
- Example: “Does water temperature affect the time taken for a sugar cube to dissolve?”
- Test it by measuring dissolving times at different temperatures.
An explanation and a prediction
A hypothesis and a prediction have different jobs.
- Hypothesis: a possible explanation that can be tested.
- Example: sugar may dissolve faster in warmer water because the water particles move faster.
- Prediction: what we expect to happen in the test.
- Example: “The sugar cube will take less time to dissolve in warmer water.” Write this before collecting results.
Make it a fair test
A variable is a factor that can change. Change one factor and keep the other important factors the same.
| Type of variable | In the sugar investigation |
|---|---|
| Independent: what we change | Water temperature |
| Dependent: what we measure | Time taken for the sugar cube to dissolve |
| Control: what we keep the same | Water volume, size of sugar cube and method of stirring |
Write a clear method
A method should let someone else repeat the investigation.
- List the equipment, amounts and measurements.
- State when to start and stop timing. Here, stop when no solid sugar is visible.
- Repeat each temperature at least three times and calculate the mean time.
- Compare the repeated results. Large differences may suggest a problem with the method or timing.
Work safely
A hazard can cause harm. A risk control reduces the chance or seriousness of that harm.
- Hot water can burn skin: use temperatures and equipment approved by your teacher.
- Spills can cause slips: keep containers away from bench edges and clean up spills.
- Never taste laboratory materials.
- Choose a different method if the investigation could harm people, animals or the environment.
Use the results honestly
Results are useful even when they disagree with a prediction.
- Record every result, including unexpected ones.
- Compare the results with your prediction.
- If they disagree, check the method and consider another explanation.
- Science also uses fieldwork, research and models. A result may lead to a new question or a revised plan.
03Worked examples
Three sugar cubes take 41 s, 43 s and 42 s to dissolve at the same temperature. Find the mean dissolving time.
Work through it
- Add the three times: 41 + 43 + 42 = 126 s.
- Divide by the number of trials: 126 ÷ 3 = 42 s.
- The mean dissolving time at this temperature was 42 s. Compare it with the mean at another temperature.
04Common mistakes
Common mistake
“Changing two factors makes the test better.”
Remember: If temperature and sugar-cube size both change, either could cause the different dissolving time. Change one factor at a time.
Common mistake
“A result that disagrees with my prediction should be deleted.”
Remember: Keep it, check for a mistake and investigate why it differs. Do not choose only results that support your prediction.
05Answering questions
- When planning a test, name what you change, what you measure and at least two factors you keep the same. Use the actual quantities in the question.
- Give a precise stopping point, such as “when no solid sugar is visible”, and explain how repeats and a mean will help you compare results.
06Infographic & reference diagrams
07Try an investigation
With your teacher, plan a dissolving investigation using three safe water temperatures. Write down the variables, the equipment, when you will stop timing and how you will repeat the test.
Do practical work with your teacher and follow the laboratory safety instructions.