By the end of this topic
- Record measurements with units and calculate a mean.
- Choose a graph and describe its pattern.
- Explain the difference between accuracy and precision.
- Identify an unusual result and suggest a useful check.
01Key terms & definitions
- Accuracy
- How close a measurement is to the accepted value.
- Precision
- How close repeated measurements are to each other.
- Repeat
- Another measurement made under the same conditions.
- Anomaly
- A result that does not fit the overall pattern.
- Correlation
- A link between two quantities in the data. This alone does not prove that one causes the other.
- Graph gradient
- The change up a graph divided by the change across it.
02Understand the idea
Make useful measurements
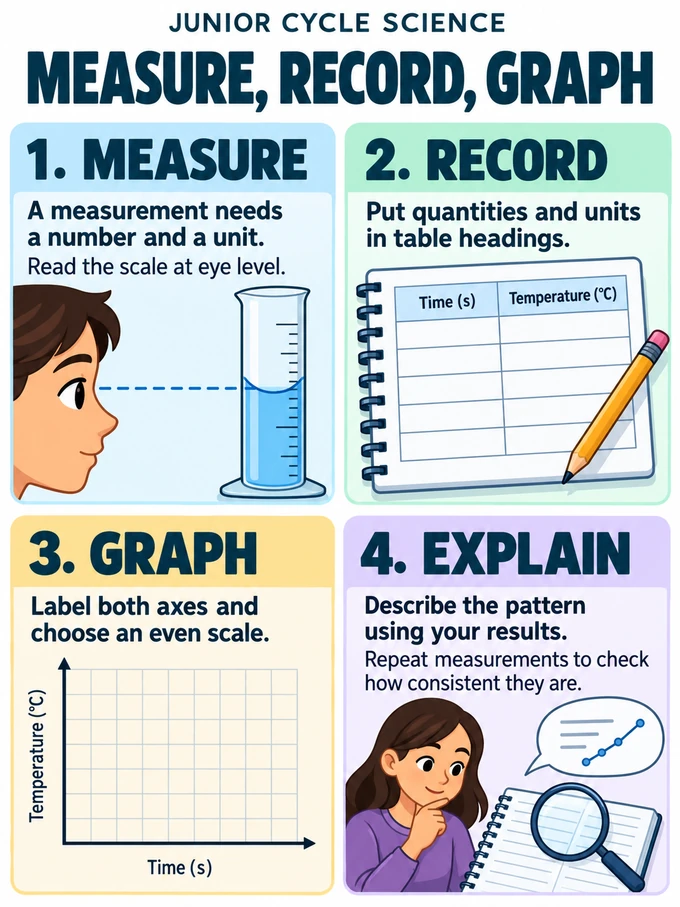
A measurement needs a number and a unit: write 12 cm, not just 12.
- Choose suitable equipment: a ruler for length, a balance for mass.
- Check that the instrument reads zero when it should.
- Read a scale with your eye level with the mark.
- Record only the detail the instrument can reasonably show.
Accuracy and precision
Close readings are not always accurate readings.
- Accuracy: how close a reading is to the accepted value.
- Precision: how close repeated readings are to one another.
- A balance that reads 2 g when empty may give similar readings that are all 2 g too high.
- Taking a mean does not remove this zero error. Zero the balance or correct for the error.
Use a results table
Prepare your results table before starting.
- Put quantities and units in the headings: for example, Force (N) and Extension (cm).
- Use separate columns for repeated readings.
- Mean: add the readings, then divide by the number of readings.
- Range: subtract the smallest reading from the largest. A larger range means more spread.
Choose and draw a graph
A graph makes patterns easier to see.
- Use a bar chart for categories, such as different materials.
- Use a scatter or line graph to compare two numerical quantities.
- Usually, put the changed variable on the horizontal axis and the measured variable on the vertical axis.
- Label each axis with its quantity and unit. Use an even scale that fills most of the graph.
- A best-fit line shows the pattern. It may be straight or curved and need not pass through every point or through zero.
Find the gradient
The gradient tells us how steep a graph is.
- Choose two widely separated points on the straight line of best fit.
- Find the vertical change and the horizontal change between them.
- Gradient = vertical change ÷ horizontal change.
- For extension against force, 2 cm per newton means 2 cm of extra extension for each extra newton, within the tested range.
Investigate unusual results
An anomaly is a result that does not fit the overall pattern.
- Check the written record and equipment, then repeat the measurement.
- Keep the original result and explain any decision to leave it out of a calculation.
- Use the results to answer the investigation question.
- State the tested range: a spring’s behaviour from 1 N to 3 N does not tell us what happens under a much larger load.
A pattern does not always show a cause
A correlation is a link between two quantities in the data.
- A correlation alone does not prove that one quantity causes the other.
- Ice-cream sales and swimming both increase in warm weather.
- Warm weather helps explain both patterns; buying ice cream does not cause someone to swim.
03Worked examples
A spring extends 2 cm under a force of 1 N and 6 cm under a force of 3 N. Find the gradient of its extension–force graph.
Work through it
- The vertical change is 6 − 2 = 4 cm.
- The horizontal change is 3 − 1 = 2 N.
- Gradient = 4 ÷ 2 = 2 cm per newton. The spring extends by 2 cm for each extra newton in this range.
04Common mistakes
Common mistake
“All the readings agree, so they must be accurate.”
Remember: They are precise, but they could all share an error. A balance with a zero error can give similar readings that are all too high.
Common mistake
“A line of best fit must join every point.”
Remember: It shows the overall pattern. Points may lie on either side; do not force the line through every point or through zero.
05Answering questions
- For a gradient, use two well-separated points on the best-fit line. Show vertical change divided by horizontal change and include the units.
- When describing a pattern, name both quantities and use values from the results. Then mention any anomaly or limit to the range tested.
06Infographic & reference diagrams
07Try an investigation
Plot the spring data supplied by your teacher. Label the axes, draw a line of best fit and identify any unusual point. Explain which measurement you would repeat and why.
Do practical work with your teacher and follow the laboratory safety instructions.