By the end of this topic
- Calculate average speed and acceleration.
- Explain the difference between speed and velocity.
- Read distance–time and velocity–time graphs.
01Key terms & definitions
- Distance
- The total length of the path an object travels.
- Average speed
- Total distance travelled divided by total time taken.
- Velocity
- Speed in a stated direction, such as 5 m/s east.
- Acceleration
- The change in velocity each second, measured in m/s².
- Distance-time gradient
- The slope of a distance–time graph. For total distance travelled, it gives the speed.
- Constant velocity
- Motion at the same speed in the same direction. The acceleration is zero.
02Understand the idea
Distance and time
Distance is the total length of the path travelled. Time is how long the journey takes.
- Measure distance in metres (m) and time in seconds (s).
- For a trolley test, mark a clear start and finish.
- Start timing as the trolley passes the first mark and stop at the second.
Calculating average speed
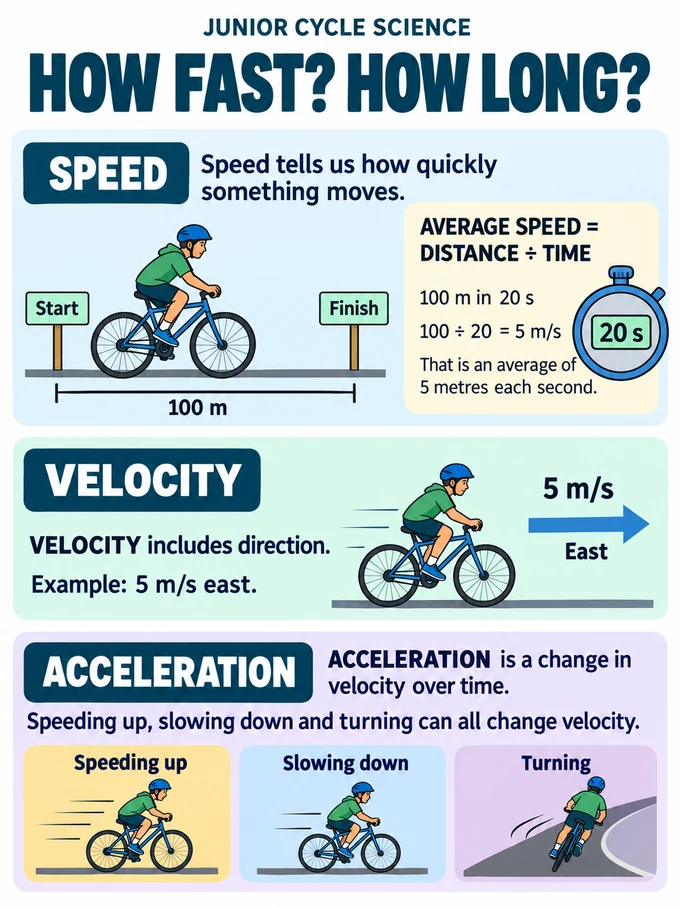
Speed tells us how quickly an object travels.
- Average speed = total distance travelled ÷ total time taken.
- A cyclist travels 150 m in 30 s: average speed = 150 ÷ 30 = 5 m/s.
- This is an average of 5 metres each second.
- An average covers the whole journey. The cyclist could speed up, slow down or stop briefly.
Speed and velocity
Velocity gives both speed and direction.
- “5 m/s” is a speed; “5 m/s east” is a velocity.
- Constant velocity means the speed and direction both stay the same.
- A car turning a corner changes velocity, even if its speed stays the same.
What is acceleration?
Acceleration tells us how quickly velocity changes.
- Speeding up, slowing down and turning all change velocity.
- Constant velocity means zero acceleration.
- For straight-line motion: acceleration = (final velocity − initial velocity) ÷ time.
- The unit is m/s². An acceleration of 2 m/s² means velocity changes by 2 m/s each second.
- If the original direction is positive, slowing down gives a negative acceleration.
Reading a distance–time graph
For total distance travelled against time, the gradient (slope) gives speed.
- Horizontal axis: time. Vertical axis: total distance travelled.
- Straight rising line: constant speed, with equal distances covered in equal times.
- Steeper line: greater speed.
- Horizontal line: no extra distance travelled, so the object is stopped.
- Line becoming steeper: the object is speeding up.
Reading a velocity–time graph
Check the axis labels: a velocity–time graph shows different information from a distance–time graph.
- Horizontal axis: time. Vertical axis: velocity.
- Horizontal line: constant velocity. A line at zero means the object is stopped.
- Gradient: acceleration.
- For motion in the positive direction, a straight rising line means velocity increases by the same amount each second.
Using the same units
Use matching units before calculating.
- Use metres and seconds for answers in m/s or m/s².
- To change km/h to m/s, divide by 3.6.
- Example: 72 km/h = 72 ÷ 3.6 = 20 m/s.
- The conversion uses 1 km = 1000 m and 1 hour = 3600 s.
03Worked examples
average speed = distance travelledtime taken
A trolley speeds up from 2 m/s to 8 m/s in 3 s, without changing direction. Find its acceleration.
Work through it
- Subtract the initial velocity from the final velocity: 8 − 2 = 6 m/s.
- Divide this change by the time: 6 ÷ 3 = 2 m/s².
- The trolley’s velocity increases by an average of 2 m/s each second.
04Common mistakes
Common mistake
“Using final velocity ÷ time for acceleration when the object was already moving.”
Remember: First find the change: final velocity − initial velocity. Then divide by time.
Common mistake
“Saying any rising graph means the object is speeding up.”
Remember: Check the axes. A straight rising distance–time line shows constant speed.
05Answering questions
- Convert speeds to the same unit before calculating a change in velocity.
- For graph questions, name the graph feature and explain it: “The line is horizontal, so the total distance stays constant.”
06Infographic & reference diagrams
07Try an investigation
Mark out a distance on a clear trolley track. Measure the time a trolley takes to travel it, then calculate its average speed. Repeat the run and compare the results. A video or light gates can help with timing.
Do practical work with your teacher and follow the laboratory safety instructions.